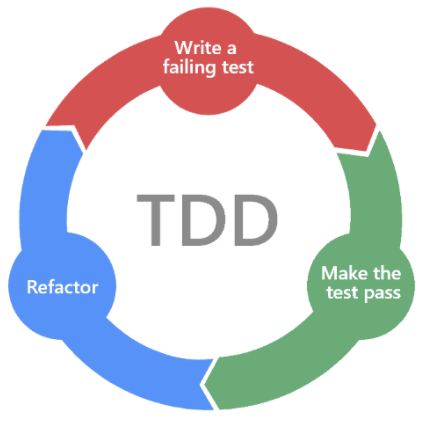
Guide for adding new report cards to ClaudeBar that analyze local data sources and display metrics with comparison deltas. Use this skill when: (1) Adding a new report/analytics card (e.g., weekly summary, model breakdown, session stats) (2) Showing usage history in a new way, or reading another tool's usage logs (3) Adding comparison cards that show "today vs previous" style deltas (4) Building any feature that follows the DailyUsage pattern (days → report value → card)
Installs into .claude/skills of the current project.
Are you the author of Add Report?
Add the live security badge to your README. It updates with every re-scan.
[](https://www.skillsdirectory.com/skills/tddworks-add-report)
---
name: add-report
description: >
  Guide for adding new report cards to ClaudeBar that analyze local data sources and display
  metrics with comparison deltas. Use this skill when:
  (1) Adding a new report/analytics card (e.g., weekly summary, model breakdown, session stats)
  (2) Showing usage history in a new way, or reading another tool's usage logs
  (3) Adding comparison cards that show "today vs previous" style deltas
  (4) Building any feature that follows the DailyUsage pattern (days → report value → card)
---

# Add Report Card to ClaudeBar

Add report cards that turn a login's usage history into metrics with comparison
deltas, shown in the existing card style, test first.

## When to Use

This skill covers **report-style features** — cards that:
- Aggregate a login's days of usage (cost, tokens, time, sessions)
- Compare periods (today vs yesterday, this week vs last week)
- Read another tool's usage logs (as data in its definition)
- Display results in cards matching the existing UI

## First, which kind of report is it?

Usage history is data now ([daily-usage design](../../../docs/features/daily-usage/design.md)).
A report is almost always a new **view over days the login already reads**, not new
reading code. Place it before anything else:

| The person wants… | It is | You write |
|---|---|---|
| a new look at usage this app already reads — this week vs last, cost per model, a 30-day chart | a **report over days**: the page asks `account.usageHistory?.days(in: range)` and a value in `Quotas` turns the days into the report | a `Quotas` value + its tests, a card. **No reading code** |
| the same history for another tool (its own log files) | a **`usageHistory` block** in that provider's definition | JSON (paths, `where`, fields, `prices`), its golden tests — no Swift |
| history from a log format no reader understands yet | a **new reader**, named for the format, in `Modules/DataSources/Sources/Internal/Logs/` | the reader, test-first in `DataSourcesTests`, then the JSON; a row in ENGINE_DESIGN §1 |
| an answer to a different question than "how much did I use?" | a **capability** (CANONICAL §2.1): declared in the definition, a handle on `Account` that is `nil` when not declared | design first; a runner outside the modules is supplied by the `Engine` (TARGET_ARCHITECTURE §10) |

**Never:** a field on `UsageSnapshot` (the kernel is shrinking toward `Usage`,
[CANONICAL_MODEL §6](../../../docs/architecture/CANONICAL_MODEL.md#6--what-is-deliberately-not-in-the-tree)),
an `XxxAnalyzer` / `XxxAnalyzing` protocol, a parser in `Sources/Infrastructure`, or a
vendor-named type in a module.

> **Reference implementation:** `references/daily-usage-pattern.md` — *TODAY'S USAGE*:
> Claude's logs and prices as data, `UsageLog` in DataSources, `account.usageHistory`,
> `DailyUsageReport` in Quotas, `DailyUsageCardView`. The Leaderboard reads 30 days the
> same way (`login.history.days(in:)` → `DailyTokens.summed`).

> **Check the design first** — the docs are the source of truth ([AGENTS.md](../../../AGENTS.md#design-docs-are-the-source-of-truth)):
> USER_JOURNEYS, CANONICAL_MODEL, TARGET_ARCHITECTURE, then the feature's `design.md`.

## How a report over days flows

```text
 <id>.json "usageHistory"  ──►  UsageLog (DataSources)        one per login, built by
                                  reader · PriceList ·          ProviderFactory from the definition
                                  DayAggregator
                                       │
 popover opens (never in the background, #204)
        │                              ▼
 account.usageHistory?.days(in: .last(14))   ──►  [DailyUsageStat]   (closed days from the ledger)
        │
        ▼
 WeeklyReport(days:)            a rich value in Modules/Quotas: deltas, percentages, formatting
        │
        ▼
 WeeklyCardView                 renders what the report says — never compares or counts
```

## Workflow

```
Phase 0: Place it and design it (get user approval)
    ↓
Phase 1: The report value + tests (TDD Red→Green)
    ↓
Phase 2: Only if needed — the definition's usageHistory, a new reader, or a capability
    ↓
Phase 3: Mockup, card view, reading it on popover open
    ↓
Phase 4: Verify, screenshots on mock data, docs
```

---

## Phase 0: Place it and design it (MANDATORY)

### Step 1: Define the report

- **What does the person want to know?** In their words (USER_JOURNEYS).
- **Which kind is it?** The table above.
- **Which days?** `DateRange` (`.last(n)`, a week, today vs yesterday).
- **Which logins?** A report is per login — two logins are two reports, never summed.
- **How many cards?** One per metric, or one combined card.

### Step 2: Diagram it

```
Example: this week vs last week, per login

┌────────────────────────────────────────────────────────────────────┐
│  Providers (module)           Quotas (module)        App           │
│                                                                    │
│  account.usageHistory   ─►  WeeklyReport(days:)  ─►  WeeklyCardView │
│   .days(in: .last(14))       thisWeek / lastWeek      × 3 metrics   │
│   → [DailyUsageStat]         deltas, %, formatted                   │
│                                                                    │
│  No reading code: claude.json's usageHistory already reads the logs│
└────────────────────────────────────────────────────────────────────┘
```

### Step 3: The pieces

| Piece | Module | One job | Test |
|---|---|---|---|
| `WeeklyReport` | `Quotas` | turns days into the comparison the card shows | `Tests/DomainTests/<Feature>/` |
| `WeeklyCardView` | `App` | renders it | AppTests / screenshots |
| *(only if needed)* `usageHistory` block, a reader, a capability | definition / `DataSources` / `Providers` | — | golden tests / `DataSourcesTests` / `ProvidersTests` |

### Step 4: Mockup and approval

A UI change gets a mockup in `design-concept/<feature>/` on mock data first
(AGENTS.md). Present the doc change, the diagram, the pieces and the mockup;
use `AskUserQuestion` and wait for approval.

---

## Phase 1: The report value (TDD)

Name each test `should <outcome> [when <situation>]`, in the person's words, never a method, type or mechanism verb → [Naming tests](../implement-feature/references/tdd-patterns.md#naming-tests).

**Location:** `Modules/Quotas/Sources/{Name}Report.swift` (beside `DailyUsageReport`),
tests in `Tests/DomainTests/{Feature}/{Name}ReportTests.swift` (beside `DailyUsageReportTests`).
It is built **from days** — `[DailyUsageStat]` — so it never reads a file:

```swift
public struct {Name}Report: Sendable, Equatable {
    public let current: [DailyUsageStat]    // e.g. this week
    public let previous: [DailyUsageStat]   // e.g. last week

    /// The days split at `boundary`, as the page asks for them.
    public init(days: [DailyUsageStat], splitAt boundary: Date) { … }

    public var cost: Decimal { current.reduce(0) { $0 + $1.totalCost } }
    public var costChangePercent: Double? {
        let before = previous.reduce(Decimal(0)) { $0 + $1.totalCost }
        guard before > 0 else { return nil }          // nil when there was nothing before
        …
    }
    public var formattedCostDelta: String { … }       // "+$5.00", "-$1.20": the sign always shown
    public var costProgress: Double { … }             // current / (current + previous), 0…1
}
```

**Rules:**
- `Decimal` for money, `TimeInterval` for durations; `Locale(identifier: "en_US")` for currency.
- Every formatted string and every comparison lives in the value — the view only reads them.
- A change percent is `nil` when the previous period is zero; deltas always carry a sign.
- `isEmpty` means all zero (`&&`, not `||`).

Write the tests first (state and return values, Chicago school), then the value.

---

## Phase 2: Only if the report needs reading it doesn't have

### 2a. Another tool's history → its definition

Add a `usageHistory` block to `<id>.json` — `files`, `format`, `where`, fields,
`prices`, `sessionGap` — the shape is in the [daily-usage design §2](../../../docs/features/daily-usage/design.md#2--the-definition-usagehistory-beside-datasources).
Golden tests in `Modules/Providers/Tests/` over fixture logs (see `ClaudeUsageHistoryTests`).
No Swift.

### 2b. A log format no reader knows → one reader in DataSources

A reader named for the **format** (`JSONLinesReader`, never `AcmeLogReader`) in
`Modules/DataSources/Sources/Internal/Logs/`, test-first in
`Modules/DataSources/Tests/Logs/` with neutral fixtures, yielding the one
`LogRecord` every reader yields. Then the JSON uses it. Add its row to
ENGINE_DESIGN §1. Only scan files changed within the range (`LogFileFinder`).

### 2c. A different question → a capability

Design it in the docs first (CANONICAL §2.1, TARGET_ARCHITECTURE): declared in
the definition, its own types in `Modules/Providers`, an `@Observable` handle on
`Account` that is `nil` when not declared — like `usageHistory` and
`guestPasses`. `ProviderFactory.make` builds it from the definition; a runner
that lives outside the modules (a CLI the App runs, the Keychain) is supplied by
the `Engine` the App builds once. The App never passes anything per provider.

---

## Phase 3: The card, read on popover open

### 3a. The card view

**Location:** `Sources/App/Views/{Name}CardView.swift`. Match the existing
cards; `DailyUsageCardView` is the reference:

```swift
struct {Name}CardView: View {
    let metric: {Name}Metric   // one case per card
    let report: {Name}Report
    let delay: Double          // cascading entrance

    @Environment(\.appTheme) private var theme

    var body: some View {
        VStack(alignment: .leading, spacing: 6) {
            // header: icon + LABEL · the large value · the progress bar · the delta line
        }
        .padding(12)
        .background(/* theme.cardGradient fill + theme.glassBorder stroke */)
    }
}
```

**Card styling checklist:** `.padding(12)` · `theme.cardGradient` + `theme.glassBorder` (1pt) ·
`theme.cardCornerRadius` · `theme.fontDesign` on text · `theme.textPrimary/Secondary/Tertiary` ·
`theme.progressTrack` · hover scale 1.015 · progress bar animated with `delay`.

### 3b. Read the days when the popover opens

Usage history is read when the popover opens, never in the background (#204),
and per login — the page asks the selected login, as `MenuContentView` does:

```swift
.task(id: login.id) {
    guard let history = login.usageHistory else { return }   // nil: this login offers none
    let days = await history.days(in: .last(14))
    report = {Name}Report(days: days, splitAt: weekStart)
}
```

The view renders `report`; it never compares, counts or decides from the days itself.

### 3c. Nothing to register

`ProviderFactory.make` builds `usageHistory` from the definition, and every
provider is found by `ProviderCatalog.detect()` (TARGET_ARCHITECTURE §10). The
App passes nothing per provider.

---

## Phase 4: Verify

1. `tuist generate`
2. `xcodebuild test -workspace ClaudeBar.xcworkspace -scheme ClaudeBar-Workspace -destination 'platform=macOS,arch=arm64'` — the full run; `tuist test` skips cached targets
3. Run the real popover on mock data (`scripts/demo-screenshots.sh`) — screenshots, never real names, emails or usage
4. Docs in the same change: the feature's `README.md` / `design.md`, one CHANGELOG line (≤300 chars), `python3 scripts/gen-docs.py && python3 scripts/check-docs.py --strict`

---

## Checklist

### Phase 0
- [ ] Placed: report over days · definition `usageHistory` · new reader · capability
- [ ] Design in the docs, diagram, pieces table, mockup in `design-concept/<feature>/`
- [ ] User approved

### Phase 1
- [ ] `{Name}ReportTests` written first (deltas, nil percent, signs, progress, empty)
- [ ] `{Name}Report` in `Modules/Quotas`, built from `[DailyUsageStat]` — green

### Phase 2 (only if needed)
- [ ] `usageHistory` block + golden tests, or a format-named reader in `DataSources` + its ENGINE_DESIGN row, or a declared capability
- [ ] No `UsageSnapshot` field, no analyzer protocol, no vendor-named Swift

### Phase 3
- [ ] `{Name}CardView` matching the card style
- [ ] Days read on popover open, per login; nothing passed in `ClaudeBarApp`

### Phase 4
- [ ] Full `xcodebuild test` green
- [ ] Screenshots on mock data
- [ ] Docs and CHANGELOG line; docs check passes